In the buzzword sweepstakes of the 90's, the clear winner has to be "Data Warehouse". A host of technologies and techniques has promised finally to achieve for the business world a dream that has been around for nigh on thirty years — the ability to obtain data about an enterprise directly from the computer in a form that is appropriate to the particular question being asked.
Contrary to claims made in the pounds of books published on the subject, data warehousing is really a very simple concept. It is based on a handful of basic principles that have been around for thirty years or more. A new cloud of jargon has made it seem as though great, momentous things are going on. They aren't.
This paper will, in its allotted hour, introduce you to all the terms and concepts necessary to make you fully "buzzword compliant" in the data warehousing field. Moreover, you may even understand it.
In 1971, your author developed a system which allowed a user to get reports on sales and sales targets, for product groups, parts of the country, and various time periods. If a particular line looked suspicious, it was possible to select that line (which, for example, might have described a product group in a region) and get a report showing it broken out by product, or by city.
Now understand that the user interface was a ten-character-per- second teletype, and the whole thing was written in Basic.
It wasn't as "user-friendly" as it might have been, and we've learned a lot about data organization since then, but the underlying objective hasn't changed. The presentations I made to my client back then were exactly the same ones I have been hearing lately, complete with "drill-down" and "multi-dimensional" access.
History
The Problem
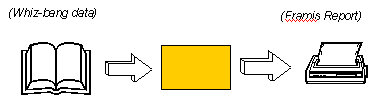
Originally there were programs. Your client would ask you to write a
program to massage some input data and produce a report. You dutifully
did this and your client was happy. See Figure 1.
Figure 1: The First Program
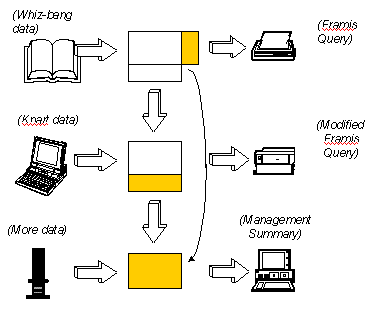
So happy that his neighbor down the hall heard about it and said, gee,
I'd like one of those too!
Could you take my data, add some of his, and produce another report?
Sure, why not. And then the third person came along and you had another program, with some more new data and some
data pulled from the other two programs. And so on. Until you had created a complex of
programs, files and reports that was so unmanageable that it collapsed of its own weight. See
Figure 2.
Figure 2: More Programs
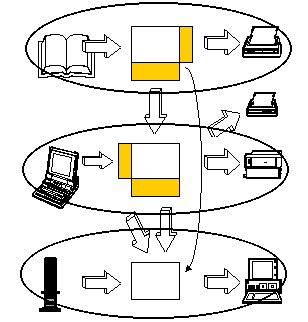
A few years back, it was recognized that this is not a profitable way to
go. What is remarkable to
realize is that the unmanagableness of the results could be traced directly
to three very specific
errors we made. See Figure 3.
Figure 3: The Problem
First of all, we designed things that tightly linked the inputs and the outputs. That is, it seemed to be the case that when data came into existance a report should be run. Moreover, the report couldn't be run until all the data required for it were available.
This is a falacy, because the timing on the input side and the output side are very different. Sources of data, for the most part, tend to be very stable. Data appear regularly every day, every week, or every month, from the infrastructure of the organization. The good news is that this is routine and in place. The bad news is that it is difficult to change if we want to.
Over on the output side, however, the sense of time is very different. There things are much more dynamic. I want this report today, containing whatever is available, and then I will throw it away. Tomorrow I am going to want a different report.
When the dynamics of output mixed with the stability of inputs, the results were not always pretty.
The second fallacy was that we assumed each of these programs or sets of programs could be developed independently of all others. We could build an marketing system separately from building our sales system, which in turn was completely independent of our manufacturing system.
This isn't true. These systems use much the same data. To design them separately is to open ourselves up to inconsistencies in the way things are defined and to make it potentially impossible to get results that cross boundaries.
The third fallacy was to encode the way the enterprise does business in the programs. All the business rules, the data structures, and the procedures were deeply imbedded in the program code. This meant that any change the business might want to undertake would require the intervention of programmers. And the programs were not always organized for easy maintenance. (Understatement time!)
The Solution
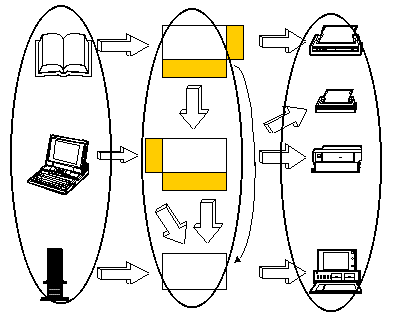
Some years ago, we realized that this wasn't the way to go. We then attempted to address all three fallacies with the introduction of "the database approach" to systems design. Under this approach, we would separate the data collection efforts from the data retrieval efforts. Instead of dividing the world horizontally, we would divide it vertically, as shown in Figure 4.
Figure 4: The Vertical Approach
Under this approach, different technologies could be used to accommodate
the different environments involved. The data collection people could
focus on bar codes, process control equipment, and other data collection
technology. The data retrieval people could make use of the latest in
fourth generation languages.
In the middle, this independence would be made possible by the introduction
of a database and standard software to maintain it. Some applications now
would be data entry applications, and others would be retrievals. The
structure of the business would be represented not in the programs but in
the structure of the data base itself. That is, the database would be
organized into tables and columns based on the things of significance to
the business and how they were related to each other. The design would
follow the discipline described as "normalization", which guarantees a
logical organization with minimum redundancy. Altogether, this led to a
new architecture, as shown in Figure 5.
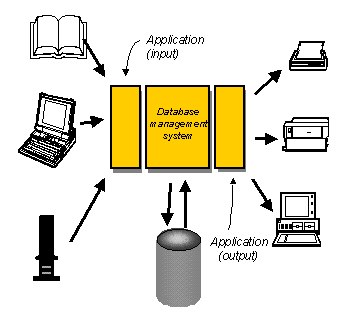
Figure 5: The Database Approach
To the extent that this approach was realized, great benefits were achieved. There were some flies in the ointment, however.
Flies in the Ointment
First of all, database systems sometimes weren't done very well. They wound up being more of the complex systems described above. The architecture which would allow the central database to be the focal point of all efforts simply wasn't built.
Second, for all their increases in speed and capacity, computers are still not infinitely capable. Where updating data organized along the lines of the company's structure might have been reasonable enough, many of the retrievals requested were prohibitively slow. Rather than having data retrieved directly from the central database, it turned out to be more expeditious to unload large quantities of data and copy them into subsidiary databases for query purposes.
From this came the data warehouse.
Solution 2
The data warehouse is nothing more than an adjustment of the database systems develop-ment approach to the realities of modern technology. As technology changes, the need for the data warehouse will diminish.
To describe the various aspects of the data warehouse, it is appropriate to examine three "rows" in John Zachman's "Framework for Systems Development". In fhis framework, each row represents the perspective of some of the participants in the systems development process. Here, the three perspectives we are interested in are:
Architect's view: The view of the person responsible for the overall structure of the information system.
Owner's view: The view of the people who carry out the business of the enterprise.
Designer's view: The view of the people who design a system, using a particular real technology.
Architect's View
The architect is concerned with the overall structure of a data warehouse
and its components.
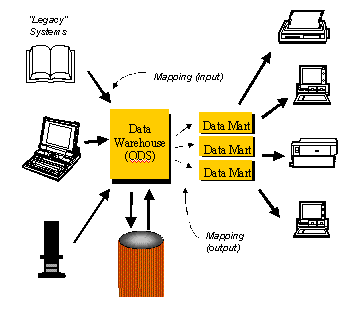
A data warehouse is a variation on the data base approach presented above.
On one side are the legacy systems, which are the ultimate sources of all
data. Acceptance of modern reality requires us to recognize that the
systems responsible for running the business are not going to be changed
overnight. So, we have to assume that our data warehouse will be fed by
other systems that are already in place. See Figure 6.
Figure 6: The Data Warehouse
In an ideal world, a company's operations would be based on and fed
directly into the central database (not through intermediate systems).
This would be organized according to the rules of proper database design,
with minimum redundancy and maximum visibility of all elements. Sometimes
this is possible: The database can be organized so that we can easily
find where each datum goes. On line transaction processing (OLTP) systems
do this.
In the data warehousing world, if the central database is indeed the basis for running the company, it is often called the operational data store (ODS). This database is based on the conceptual enterprise model, but it's focus is on immediate transactions required to run the immediate tasks of the business. It won't necessarily retain very much history.
The same conceptual model may be the basis for the data warehouse itself — that is, the central "warehouse" part of a data warehouse system. In this case, however, more history is maintained, and summary data may be calculated and stored. Indeed, some detail level information may not be held at all. Moreover, where the ODS is dynamic, being updated continuously as part of operations, the data warehouse may be more static, with periodic updates.
On the output side, life is more difficult.
Users are confronted with the task of extracting, summarizing and displaying part of a vast amount of data. In general terms, this task is called data mining.
Note that there are two elements to data mining: First, there is the physical retrieval of the data believed to be important. This is primarily a technological problem, which can be addressed in a straight-forward manner with the appropriate tools. Second, there is the need to analyze and present the data appropriately, such that the conclusions drawn from them are in fact appropriate. This is harder to do well, and is a matter of skill and experience.
Users typically require data from many parts of the data base, and a lot of it. They also want it quickly, since there usually is someone sitting there, waiting for the query to finish. What is needed here is on line analytical processing (OLAP). This is a collection of technologies that make it relatively easy to retrieve large quantities of data and analyze them in many different ways. More about that below.
To accommodate this, the practical solution turns out to be to create separate databases, each designed to make certain kinds of queries run faster. If the operational data store uses the metaphor data warehouse to describe its orderly storage of lots of data (imagine the potato chips stored in one part of a warehouse, the sodas in another, and the video tapes in a third), the subsidery databases are more like local convenience stores, with each designed so that things most often retrieved together (like potato chips, sodas, and video tapes) are close together in the database architecture.
These are typically called data marts.
Managing all of this is not a trivial task. The first and foremost requirement is to understand what it is we are managing. Ultimately we are managing the definitions of data. We are deciding that certain data go in one place or the other. To support this, we need a database that contains those definitions of what data we are managing and where they all are. Such a database is these days called a repository.
The data in the repository that describes the data in the warehouse are called metadata. Hence, the full name of the repository is metadata repository. (Gasp!) Included in the metadata are the definitions of all tables and columns as well as the entity classes and attributes that provide the architectures for the databases. Also included are the mappings that define how the data in legacy systems correspond to the data in the ODS and how the ODS data correspond to the data mart data.
Now repositories of metadata have been around for longer than data warehouses have been in vogue. Originally they were called "data dictionaries" and they kept track of file layouts in mainframe computers. When CASE tools came along, it was they who stored the objects of their analysis in data bases that looked suspiciously like reposi-tories look today.
Note, by the way, that a lot of companies are on the market selling repositories. Many do this without including CASE tools in them. Moreover, while some of them can communicate with some CASE tools, many cannot even do that. In fact most of these only store data about tables and columns, without any room for storing the entity models that are the architectural basis for those tables and columns. While Oracle doesn't market Designer/2000 as a "repository tool", in fact it compares favorably with many on the market under that umbrella.
Owner's View
So, what is a user looking for in a data warehouse? There are actually several layers of massaging of data that are popular.
First of all, if the operational data store contains every transaction for an indefinite period of time, the first step is to simply summarize these data by month and add some calculated totals – at the same time possibly losing data deemed older than is interesting. As described above, this moves data from the operational data store to the central data warehouse itself, producing a kind of "distribution center".
In either case, however, the architecture of the data should reflect the Corporate Logical Data Model.
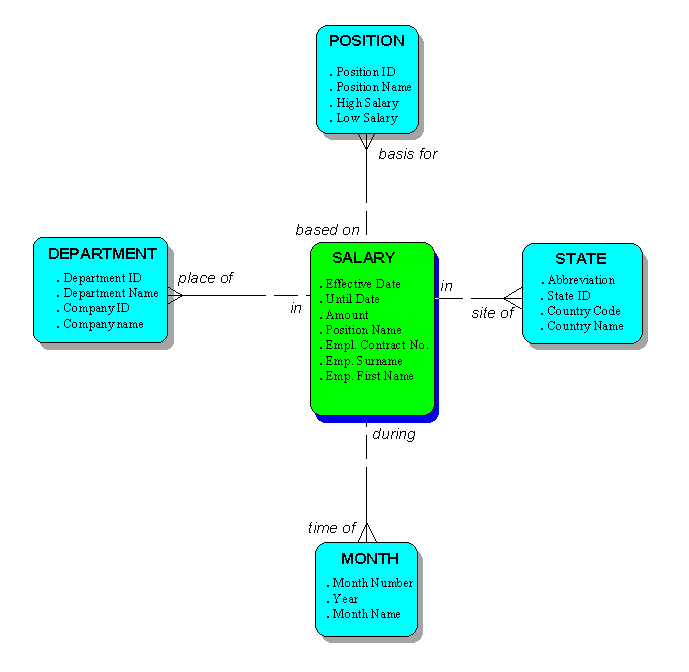
For users, though, a greater degree of summarization is requred. Specifically, data marts are often organized in terms of facts and the dimensions by which you retrieve the facts. For example, facts might be sales, revenue, profit, number of employees, or some other measurement. Each of these facts, in turn, may be represented in terms of various dimensions, like "time", "product and product group", "geography", and "customer and customer group". For example, a user might ask for salaries for a particular position, a particular department, a part of the country, and a time period. It is the dimensions which give meaning to the number.
Figure 7: A Multidimensional Star Schema
Because the model of the data mart typically shows the fact table in the middle and tables representing the dimensions arrayed around it, this design is called a star schema. (See Figure 7.)
This implies a fairly dramatic reworking of the Corporate Data Model architecture to get to this point. Each of the dimension and fact tables can, however, be mapped directly to combinations of entities in the Corporate Model.
(See your author's article "From Relational to Multi-dimensional Databases" in the Proceedings of the 1997 ECO conference, sponsored by the East Coast Oracle User's Group.)
If you subdivide the state table into city, state, and country, and similarly divide the other dimensions in to smaller pieces, you have a snowflake schema. Databases organized according to these schemata are called multi-dimensional databases.
Note that in designing the operational data store (and in preparing the models that are the basis for that design), rules must be followed which guarantee that the design will be stable and not subject to change very frequently. The whole point of data marts, however, is that each reflects a particular point of view and is designed to make a particular kind of retrieval efficient. People's needs change. Hence, the business of managing a data warehouse involves the requirement to be able to set up new data marts easily and quickly.
The retrieval languages used to get at the data are becoming progressively more sophisticated as the years go on. One in particular, COGNOS, can look at a multidimensional database and represent the data as a cube. In this cube, each dimension really is a dimension.
The more sophisticated languages insert a management layer between the underlying databases and the user. Someone is charged with translating the objects in the database to objects understood by the user. And vendors are beginning to establish links directly between the retrieval languages and various repositories.
Designer's View
So what problems does all this leave the person who actually has to build the warehouse? Data base management systems and CASE tools like Designer/2000 make it reasonable to build the operational data store and the data marts. Operational data stores are ideal candidates for relational database management systems. Data marts can be implemented relationally as well, although there are companies selling alternative kinds of database management systems for multi-dimensional data.
What remains difficult is dealing with the legacy systems.
Whether or not they used database technology, legacy systems very often are badly organizaed and because of that they are difficult to understand. What is required is for someone to sit down and examine each column in each table to determine where that piece of information goes in the data warehouse. The people who do this must be intimately familiar with both the original systems and the model of the operational data store. Repository tools can help in this process by providing a visible place to record the mappings, but ultimately it is simply a very difficult job that someone must do.
Note that one function of the ODS is to make it possible to design and create new data marts without having to go back to the legacy systems each time to figure out where the desired data are to be found. Presumably the architecture of the ODS is transparent enough that each time a new data mart must be designed, it is straight-forward to determine exactly where the data should come from.
Once the mappings from the legacy systems to the ODS and from the ODS to the data marts have been defined, it remains necessary physically to copy data from the legacy systems to the operational data store, and from there to the data marts. A small industry has grown up around this task, with various companies offering software that accepts the mapping specifications and uses them to copy the data from one place to another. Platinum, Prism, ETI and Informatica are some of the companies that do this.
What's Easy and What's Hard
The concepts described here are all the concepts required to understand what a data warehouse is and what is required in order to build one. Understanding data warehousing is easy. Actually building one is hard. It entails at least the following steps:
Develop a corporate data model to be the basis for the ODS.
Generate the ODS and data entry programs for maintaining reference data not to be retrieved from legacy data.
Map each legacy column to the logical data model, and from there to the ODS.
Define "clensing" rules to make sure that only valid data get into the data warehouse.
Determine the technologies to be used for copying and clensing.
Define the schedules for loading legacy data into the ODS.
Load the legacy data into the ODS.
Determine the technology to be used for queries.
Define one or more data marts.
Map each data mart column to the appropriate logical data model attribute, and through that to the appropriate ODS column.
Define the transformations required to copy data from the ODS to each data mart.
Define the schedule for loading ODS data into each data mart.
If the tool permits it, define the set of objects to be visible to each user.
Define and program any appropriate standard queries.
Load data and start querying.
Repeat steps 9-15 as necessary.
Good luck!
Glossary
Applications Approach
The design and construction of systems on an application area by application area basis. (cf: Database Approach)
Architect's View
The perspective on systems development taken by the person responsible for the overall structure of the system.
Cube
A way of representing data as the intersect of "dimensions" in a cube. A visual metaphor for a "multi-dimensional database".
Database Approach
The design and construction of systems around a central database, with applications implemented as a series of updates to and retrievals from a database. (cf: Applications Approach)
Data Marts
Databases established specifically to make certain kinds of retrievals more efficient.
Data Warehouse
(1) A system consisting of a central database, a series of derivative databases, and the means to move data from legacy systems to the central database to the derivative databases (2) The central database in such a system.
Designer's View
The perspective on systems development taken by the person responsible for applying technology to the solution of business problems.
Dimension
An index into a set of facts, such as "product", "geography", etc.
Fact
A piece of information (usually numeric) that is the target of a typical retrieval.
Mapping
Recognition that a particular column in one database means the same thing as another column in another database, or the same thing as an attribute in a data model.
Metadata
The set of data that describe the data in a system. This may include table and column definitions, program definitions, entity and attribute definitions, or update schedule definitions, among other things.
Multi-dimensional Database
A database organized in terms of "facts" and "dimensions".
Normalization
The organization of data in terms of rules which guarantee that there is minimum redundancy in the data.
ODS
(See "Operational Data Store".)
OLAP
(See "On-line Transaction Processing".)
On Line Transaction Processing
The collection of business transactions to update a database directly. (cf: On-line Analytical Processing)
Operational Data Store
The central database in a data warehouse that collects data from operational transactions, and organizes them in a way that minimizes redundancy and maximises the visibility of each datum. It is organized in a "normalized" fashion.
Owner's View
The perspective on systems development held by the person(s) who actually use the system to run a business.
Repository
The database containing all the definitions (cf: "Metadata") required to manage a data warehouse.
Snowflake Schema
An organization of data for a "Data Mart" whereby a "fact" table is related to one or more "dimension" tables, where more than one table is present for one or more of the dimensions. (cf: "Star Schema")
Star Schema
An organization of data for a "Data Mart" whereby a "fact" table is related to one or more "dimension" tables, where only one table is present for each dimension. (cf: "Snowflake Schema")